I was recently talking to a public market investor about Facebook ad performance of late and he was particularly concerned about the relative cost and performance of Reels inventory versus Feed inventory.
He was wondering what share of spend Reels were consuming and how that inventory compared from a CAC & CPM perspective.
That inspired this analysis, as I wanted to at least look at the share of spend both Reels and Stories were consuming from our clients’ campaigns.
My ad account criteria:
- The ad account had active spend every month on Facebook from May 2021 to May 2023.
- Ad accounts were primarily e-commerce accounts with some lead gen and mobile app clients mixed in.
- Currency was USD.
My report structure:
- Breakdown by Account Name, Placement, and Month
- May 1, 2021 through May 31, 2023
- Metrics are Impressions, Amount Spent, Link Clicks, Purchases, and Purchase Conversion Value
I ended up including 91 accounts in this analysis totaling a little over $400m in spend over this 3-year period.
Facebook’s reporting tool spat out this raw list of placements:
- All (Automated App Ads)
- all_placements
- an_classic
- biz_disco_feed
- facebook_groups_feed
- facebook_reels
- facebook_reels_overlay
- facebook_stories
- feed
- instagram_explore
- instagram_explore_grid_home
- instagram_igtv
- instagram_profile_feed
- instagram_reels
- instagram_search
- instagram_shop
- instagram_stories
- instant_article
- instream_video
- marketplace
- messenger_inbox
- messenger_stories
- rewarded_video
- right_hand_column
- search
- unknown
- Video_feeds
The Data
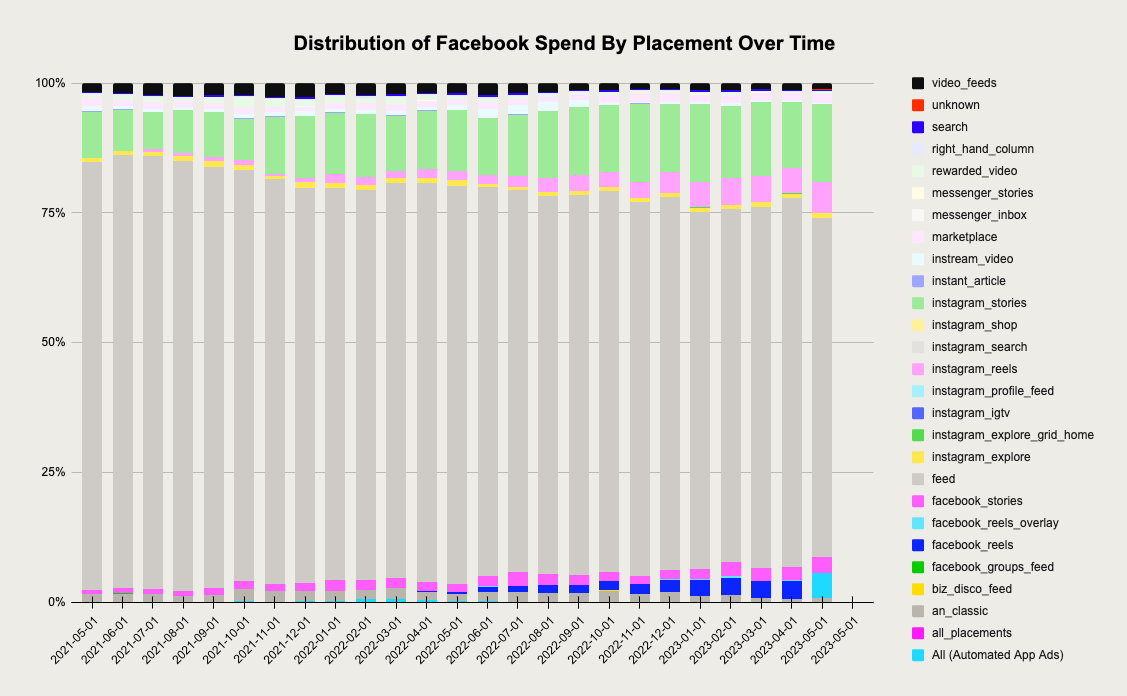
The core Feed placement has decreased in share from the low 80%s to around 65-70%. For our clients, Reels (both Instagram and Facebook) constitute about 11% of total spend, and Stories (again both Facebook & Instagram) constitute about 18% of spend.
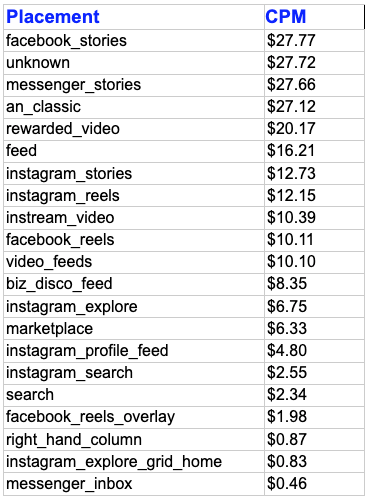
The CPM data (pulled from May 2023) is more or less what you’d expect, with Feed coming in around $16 versus $10-$12 for the main Stories and Reels placements.
Overall, the analysis shows that Reels and Stories have been consuming a significant share of ad spend compared to the core Feed placement for our clients over the last two years. Additionally, the cost per impression tends to be lower for Reels and Stories compared to the Feed placement.